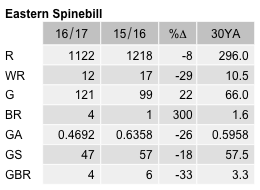
Eastern Spinebill
Acanthorhynchus tenuirostris
ABR description
The following is extracted from the Annual Bird Report for the twelve months to June 2017.
Common, breeding resident
A common bird of gardens, particularly in autumn and winter.
General: The number of records decreased from last year and reporting rate declined from 10.4% to 8.1%, well above the lowest reporting rate of 5.6% in 2009, and comparable to the long-term averages. Observed throughout the year but a higher proportion of sightings in autumn (30%) and winter (36%). Breeding records typically rare, 5 this year after 1 last year, all dy, on 6 Nov, 9 Nov and 18 Nov at ANBG, 15 Jan Collector Rd GrU07 and 7 Apr Murrumbateman.
GBS: Recorded from 80% of sites, slightly less than last year (85%). Abundance was also lower than last year (26% lower) and below the 30YA. More birds seen in autumn (36%) and winter (34%), similar to the general records. 4 breeding records, all dy, earliest 1wk Nov Red Hill GrK14 (WaR4), 3 from 1 site in Page GrJ12, 1 3wk Feb (AlB1).
Abundance
Abundance is the average number of birds of that species per survey. Where the species was observed (presence recorded) but the number of birds seen was not recorded, this is treated as a count of zero.
Abundance by year
This chart shows the abundance of Eastern Spinebill between 1982 and 2017. 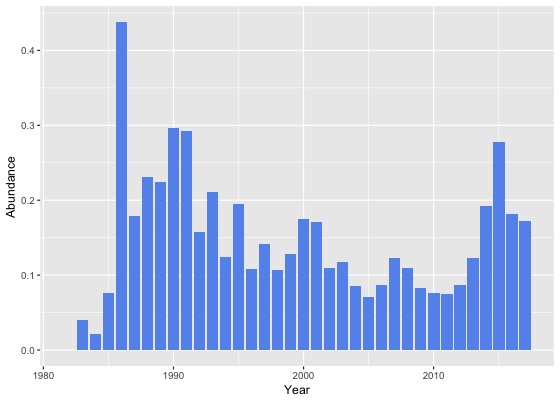
Abundance by month
This chart shows the monthly abundance of Eastern Spinebill. The blue lines show the abundance for the twelve months to June 2017 and the bars show the average abundance for the period 1982 to 2017. 
Abundance by season
This chart shows the seasonal abundance of Eastern Spinebill. The blue lines show the seasonal abundance for the twelve months to June 2017 and the bars show the average seasonal abundance for the period 1982 to 2017. 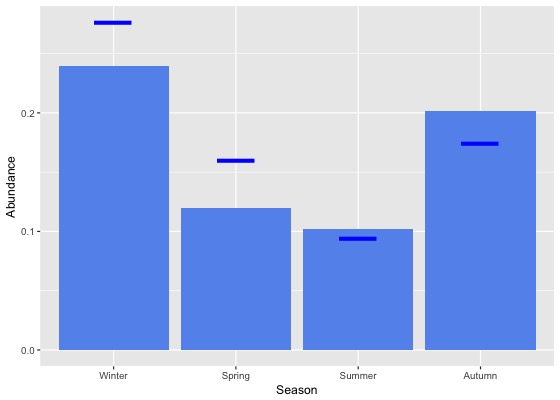
Abundance data
| Month | Season | ||||||||||||||||||
|---|---|---|---|---|---|---|---|---|---|---|---|---|---|---|---|---|---|---|---|
| Period | Jul | Aug | Sep | Oct | Nov | Dec | Jan | Feb | Mar | Apr | May | Jun | Winter | Spring | Summer | Autumn | All | ||
| All years | |||||||||||||||||||
| All | 0.3 | 0.3 | 0.1 | 0.1 | 0.1 | 0.1 | 0.1 | 0.1 | 0.1 | 0.2 | 0.3 | 0.2 | 0.2 | 0.1 | 0.1 | 0.2 | 0.2 | ||
| Previous years | |||||||||||||||||||
| All previous years | 0.3 | 0.2 | 0.1 | 0.1 | 0.1 | 0.1 | 0.1 | 0.1 | 0.1 | 0.2 | 0.3 | 0.2 | 0.2 | 0.1 | 0.1 | 0.2 | 0.2 | ||
| Previous 30 years | 0.3 | 0.3 | 0.1 | 0.1 | 0.1 | 0.1 | 0.1 | 0.1 | 0.1 | 0.2 | 0.3 | 0.2 | 0.2 | 0.1 | 0.1 | 0.2 | 0.2 | ||
| Previous 20 years | 0.3 | 0.3 | 0.1 | 0.1 | 0.1 | 0.1 | 0.1 | 0.1 | 0.1 | 0.2 | 0.3 | 0.2 | 0.2 | 0.1 | 0.1 | 0.2 | 0.1 | ||
| 10 year groups | |||||||||||||||||||
| [2007,2017) | 0.3 | 0.3 | 0.1 | 0.1 | 0.1 | 0.1 | 0.1 | 0.1 | 0.1 | 0.2 | 0.3 | 0.2 | 0.3 | 0.1 | 0.1 | 0.2 | 0.2 | ||
| [1997,2007) | 0.2 | 0.2 | 0.1 | 0.1 | 0.1 | 0.1 | 0.1 | 0.1 | 0.1 | 0.2 | 0.2 | 0.1 | 0.2 | 0.1 | 0.1 | 0.2 | 0.1 | ||
| [1987,1997) | 0.2 | 0.2 | 0.2 | 0.2 | 0.1 | 0.1 | 0.2 | 0.1 | 0.2 | 0.3 | 0.3 | 0.3 | 0.2 | 0.2 | 0.1 | 0.3 | 0.2 | ||
| 5 year groups | |||||||||||||||||||
| [2012,2017) | 0.3 | 0.3 | 0.2 | 0.1 | 0.1 | 0.1 | 0.1 | 0.1 | 0.2 | 0.3 | 0.3 | 0.3 | 0.3 | 0.1 | 0.1 | 0.2 | 0.2 | ||
| [2007,2012) | 0.2 | 0.1 | 0.1 | 0.1 | 0.0 | 0.0 | 0.1 | 0.1 | 0.1 | 0.1 | 0.2 | 0.1 | 0.1 | 0.1 | 0.1 | 0.1 | 0.1 | ||
| [2002,2007) | 0.1 | 0.2 | 0.1 | 0.1 | 0.1 | 0.0 | 0.1 | 0.1 | 0.1 | 0.1 | 0.1 | 0.1 | 0.1 | 0.1 | 0.1 | 0.1 | 0.1 | ||
| [1997,2002) | 0.3 | 0.3 | 0.1 | 0.1 | 0.1 | 0.1 | 0.1 | 0.1 | 0.1 | 0.3 | 0.3 | 0.2 | 0.2 | 0.1 | 0.1 | 0.2 | 0.2 | ||
| [1992,1997) | 0.1 | 0.2 | 0.1 | 0.1 | 0.1 | 0.1 | 0.3 | 0.1 | 0.3 | 0.2 | 0.3 | 0.2 | 0.2 | 0.1 | 0.1 | 0.2 | 0.2 | ||
| [1987,1992) | 0.3 | 0.2 | 0.2 | 0.2 | 0.2 | 0.1 | 0.2 | 0.1 | 0.2 | 0.3 | 0.4 | 0.3 | 0.3 | 0.2 | 0.1 | 0.3 | 0.2 | ||
| Year | |||||||||||||||||||
| 2017 | 0.3 | 0.3 | 0.2 | 0.2 | 0.1 | 0.1 | 0.1 | 0.1 | 0.1 | 0.2 | 0.2 | 0.2 | 0.3 | 0.2 | 0.1 | 0.2 | 0.2 | ||
| 2016 | 0.3 | 0.3 | 0.2 | 0.1 | 0.1 | 0.1 | 0.1 | 0.1 | 0.1 | 0.2 | 0.3 | 0.3 | 0.3 | 0.1 | 0.1 | 0.2 | 0.2 | ||
| 2015 | 0.4 | 0.7 | 0.4 | 0.2 | 0.1 | 0.2 | 0.1 | 0.2 | 0.2 | 0.4 | 0.4 | 0.3 | 0.5 | 0.2 | 0.2 | 0.3 | 0.3 | ||
| 2014 | 0.3 | 0.3 | 0.1 | 0.1 | 0.0 | 0.1 | 0.1 | 0.2 | 0.2 | 0.2 | 0.5 | 0.4 | 0.3 | 0.1 | 0.1 | 0.3 | 0.2 | ||
| 2013 | 0.3 | 0.2 | 0.1 | 0.1 | 0.0 | 0.0 | 0.1 | 0.1 | 0.1 | 0.2 | 0.4 | 0.1 | 0.2 | 0.1 | 0.1 | 0.2 | 0.1 | ||
| 2012 | 0.2 | 0.1 | 0.1 | 0.1 | 0.0 | 0.0 | 0.1 | 0.1 | 0.1 | 0.1 | 0.1 | 0.2 | 0.1 | 0.1 | 0.1 | 0.1 | 0.1 | ||
| 2011 | 0.2 | 0.1 | 0.0 | 0.1 | 0.1 | 0.0 | 0.1 | 0.1 | 0.0 | 0.1 | 0.1 | 0.1 | 0.1 | 0.1 | 0.0 | 0.1 | 0.1 | ||
| 2010 | 0.2 | 0.1 | 0.0 | 0.1 | 0.0 | 0.0 | 0.1 | 0.1 | 0.0 | 0.1 | 0.2 | 0.1 | 0.1 | 0.1 | 0.0 | 0.1 | 0.1 | ||
| 2009 | 0.1 | 0.1 | 0.1 | 0.1 | 0.0 | 0.0 | 0.1 | 0.0 | 0.1 | 0.2 | 0.1 | 0.1 | 0.1 | 0.1 | 0.1 | 0.1 | 0.1 | ||
| 2008 | 0.2 | 0.1 | 0.1 | 0.1 | 0.1 | 0.0 | 0.1 | 0.1 | 0.1 | 0.2 | 0.2 | 0.1 | 0.2 | 0.1 | 0.1 | 0.1 | 0.1 | ||
| 2007 | 0.1 | 0.1 | 0.0 | 0.1 | 0.0 | 0.0 | 0.1 | 0.2 | 0.1 | 0.2 | 0.5 | 0.1 | 0.1 | 0.1 | 0.1 | 0.2 | 0.1 | ||
| 2006 | 0.1 | 0.1 | 0.1 | 0.1 | 0.1 | 0.0 | 0.2 | 0.0 | 0.0 | 0.1 | 0.1 | 0.1 | 0.1 | 0.1 | 0.1 | 0.1 | 0.1 | ||
| 2005 | 0.1 | 0.1 | 0.1 | 0.0 | 0.1 | 0.0 | 0.0 | 0.1 | 0.1 | 0.1 | 0.1 | 0.1 | 0.1 | 0.1 | 0.1 | 0.1 | 0.1 | ||
| 2004 | 0.1 | 0.2 | 0.0 | 0.1 | 0.0 | 0.0 | 0.1 | 0.2 | 0.0 | 0.1 | 0.1 | 0.0 | 0.1 | 0.0 | 0.1 | 0.1 | 0.1 | ||
| 2003 | 0.2 | 0.3 | 0.1 | 0.1 | 0.1 | 0.0 | 0.1 | 0.2 | 0.1 | 0.2 | 0.2 | 0.1 | 0.2 | 0.1 | 0.1 | 0.2 | 0.1 | ||
| 2002 | 0.2 | 0.2 | 0.1 | 0.0 | 0.1 | 0.1 | 0.0 | 0.0 | 0.2 | 0.2 | 0.2 | 0.1 | 0.2 | 0.1 | 0.0 | 0.2 | 0.1 | ||
| 2001 | 0.3 | 0.5 | 0.2 | 0.1 | 0.1 | 0.1 | 0.1 | 0.1 | 0.1 | 0.2 | 0.3 | 0.1 | 0.3 | 0.1 | 0.1 | 0.2 | 0.2 | ||
| 2000 | 0.3 | 0.2 | 0.1 | 0.1 | 0.1 | 0.1 | 0.1 | 0.1 | 0.2 | 0.5 | 0.3 | 0.2 | 0.2 | 0.1 | 0.1 | 0.3 | 0.2 | ||
| 1999 | 0.1 | 0.2 | 0.1 | 0.1 | 0.1 | 0.1 | 0.1 | 0.1 | 0.1 | 0.1 | 0.2 | 0.2 | 0.2 | 0.1 | 0.1 | 0.2 | 0.1 | ||
| 1998 | 0.0 | 0.1 | 0.2 | 0.2 | 0.0 | 0.1 | 0.2 | 0.2 | 0.0 | 0.1 | 0.1 | 0.1 | 0.1 | 0.1 | 0.1 | 0.1 | 0.1 | ||
| 1997 | 0.3 | 0.1 | 0.1 | 0.1 | 0.0 | 0.0 | 0.2 | 0.1 | 0.5 | 0.2 | 0.3 | 0.0 | 0.2 | 0.1 | 0.1 | 0.3 | 0.1 | ||
| 1996 | 0.2 | 0.0 | 0.1 | 0.0 | 0.0 | 0.1 | 0.1 | 0.0 | 0.1 | 0.1 | 0.1 | 0.4 | 0.2 | 0.1 | 0.1 | 0.1 | 0.1 | ||
| 1995 | 0.1 | 0.1 | 0.1 | 0.1 | 0.1 | 0.1 | 0.6 | 0.0 | 0.3 | 0.2 | 0.3 | 0.5 | 0.2 | 0.1 | 0.3 | 0.3 | 0.2 | ||
| 1994 | 0.1 | 0.2 | 0.1 | 0.1 | 0.1 | 0.1 | 0.2 | 0.1 | 0.2 | 0.1 | 0.1 | 0.1 | 0.1 | 0.1 | 0.1 | 0.1 | 0.1 | ||
| 1993 | 0.3 | 0.5 | 0.0 | 0.1 | 0.0 | 0.0 | 0.3 | 0.1 | 0.4 | 0.2 | 0.4 | 0.0 | 0.3 | 0.1 | 0.1 | 0.3 | 0.2 | ||
| 1992 | 0.0 | 0.1 | 0.1 | 0.1 | 0.2 | 0.0 | 0.0 | 0.0 | 0.2 | 0.2 | 0.7 | 0.1 | 0.1 | 0.1 | 0.0 | 0.4 | 0.2 | ||
| 1991 | 0.5 | 0.2 | 0.3 | 0.3 | 0.2 | 0.1 | 0.1 | 0.1 | 0.2 | 0.7 | 0.2 | 0.6 | 0.4 | 0.3 | 0.1 | 0.3 | 0.3 | ||
| 1990 | 0.2 | 0.2 | 0.2 | 0.0 | 0.1 | 0.1 | 0.1 | 0.1 | 0.3 | 0.6 | 1.1 | 0.8 | 0.3 | 0.1 | 0.1 | 0.6 | 0.3 | ||
| 1989 | 0.2 | 0.2 | 0.3 | 0.2 | 0.2 | 0.2 | 0.2 | 0.2 | 0.2 | 0.3 | 0.3 | 0.3 | 0.2 | 0.2 | 0.2 | 0.3 | 0.2 | ||
| 1988 | 0.3 | 0.3 | 0.2 | 0.2 | 0.2 | 0.2 | 0.2 | 0.1 | 0.3 | 0.3 | 0.3 | 0.3 | 0.3 | 0.2 | 0.2 | 0.3 | 0.2 | ||
| 1987 | 0.1 | 0.1 | 0.2 | 0.1 | 0.1 | 0.1 | 0.1 | 0.1 | 0.2 | 0.2 | 0.3 | 0.3 | 0.2 | 0.2 | 0.1 | 0.2 | 0.2 | ||
| 1986 | 0.4 | 0.2 | 0.8 | 0.5 | 0.5 | 0.3 | 0.5 | 0.2 | 0.2 | 0.4 | 0.7 | 0.5 | 0.4 | 0.6 | 0.3 | 0.4 | 0.4 | ||
| 1985 | 0.0 | 0.0 | 0.1 | 0.0 | 0.0 | 0.0 | 0.1 | 0.1 | 0.1 | 0.1 | 0.1 | 0.6 | 0.2 | 0.0 | 0.0 | 0.1 | 0.1 | ||
| 1984 | 0.0 | 0.0 | 0.0 | 0.0 | 0.0 | 0.0 | 0.0 | 0.0 | 0.0 | 0.0 | 0.1 | 0.0 | 0.0 | 0.0 | 0.0 | 0.0 | 0.0 | ||
| 1983 | 0.0 | 0.0 | 0.0 | 0.0 | 0.2 | 0.2 | 0.0 | 0.0 | 0.0 | - | 0.0 | 0.0 | 0.0 | 0.1 | 0.1 | 0.0 | 0.0 | ||
| 1982 | - | 0.0 | - | 0.0 | 0.0 | 0.0 | - | 0.0 | - | 0.0 | - | 0.0 | 0.0 | 0.0 | 0.0 | 0.0 | 0.0 | ||
Reporting rates
Reporting rate is the proportion of all surveys in which the species was present.
Reporting rate by year
This chart shows the reporting rate of Eastern Spinebill each year between 1982 and 2017. 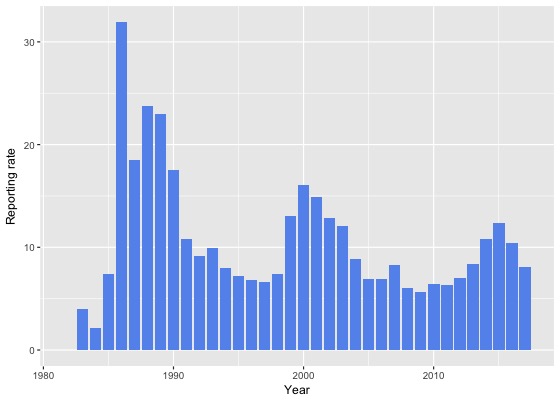
Reporting rate by month
This chart shows the reporting rate by month of Eastern Spinebill. The blue lines show the reporting rate for the twelve months to June 2017 and the bars show the average reporting rate for the period 1982 to 2017. 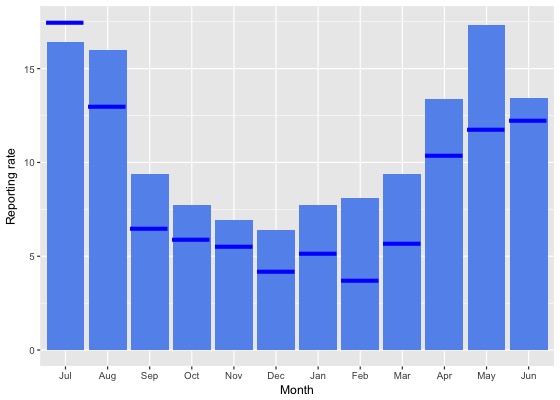
Reporting rate by season
This chart shows the seasonal reporting rate of Eastern Spinebill. The blue lines show the seasonal reporting rate for the twelve months to June 2017 and the bars show the average seasonal reporting rate for the period 1982 to 2017. 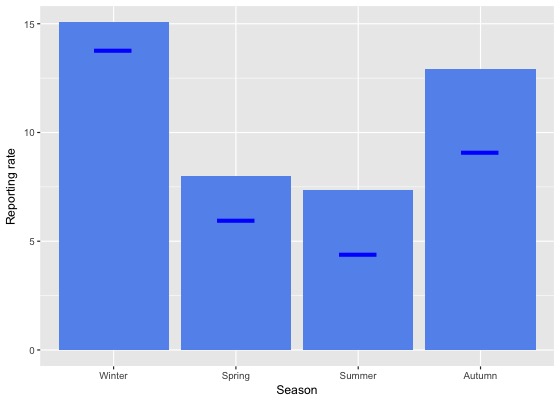
Reporting rate data
| Month | Season | ||||||||||||||||||
|---|---|---|---|---|---|---|---|---|---|---|---|---|---|---|---|---|---|---|---|
| Period | Jul | Aug | Sep | Oct | Nov | Dec | Jan | Feb | Mar | Apr | May | Jun | Winter | Spring | Summer | Autumn | All | ||
| All years | |||||||||||||||||||
| All | 16.4 | 16.0 | 9.4 | 7.7 | 6.9 | 6.4 | 7.7 | 8.1 | 9.4 | 13.4 | 17.3 | 13.4 | 15.1 | 8.0 | 7.4 | 12.9 | 10.5 | ||
| Previous years | |||||||||||||||||||
| All previous years | 16.3 | 16.6 | 9.8 | 8.0 | 7.1 | 6.7 | 8.2 | 9.0 | 10.1 | 13.9 | 18.6 | 13.7 | 15.3 | 8.3 | 7.9 | 13.6 | 10.9 | ||
| Previous 30 years | 16.3 | 16.7 | 9.6 | 7.9 | 6.9 | 6.7 | 8.2 | 9.0 | 10.1 | 13.8 | 18.6 | 13.5 | 15.3 | 8.2 | 7.9 | 13.6 | 10.9 | ||
| Previous 20 years | 15.4 | 16.4 | 8.2 | 7.0 | 5.4 | 5.8 | 7.5 | 8.3 | 9.1 | 12.3 | 17.6 | 12.3 | 14.3 | 7.0 | 7.1 | 12.3 | 9.8 | ||
| 10 year groups | |||||||||||||||||||
| [2007,2017) | 15.5 | 15.1 | 7.5 | 6.4 | 4.5 | 5.8 | 6.9 | 7.5 | 9.0 | 11.4 | 16.7 | 12.5 | 14.1 | 6.3 | 6.7 | 11.7 | 9.2 | ||
| [1997,2007) | 15.4 | 19.4 | 9.7 | 9.0 | 7.4 | 5.7 | 9.7 | 10.1 | 9.4 | 14.6 | 19.8 | 11.7 | 14.9 | 8.8 | 8.1 | 13.6 | 11.1 | ||
| [1987,1997) | 19.1 | 17.5 | 16.7 | 13.5 | 11.9 | 11.8 | 12.0 | 12.8 | 15.7 | 21.6 | 22.4 | 20.0 | 18.8 | 13.9 | 12.2 | 19.8 | 16.1 | ||
| 5 year groups | |||||||||||||||||||
| [2012,2017) | 17.3 | 16.8 | 8.8 | 7.3 | 4.7 | 6.9 | 7.3 | 7.9 | 9.8 | 12.5 | 17.8 | 14.7 | 16.1 | 7.1 | 7.4 | 12.8 | 10.2 | ||
| [2007,2012) | 10.3 | 9.3 | 4.5 | 4.9 | 4.0 | 3.5 | 5.3 | 6.0 | 6.6 | 8.9 | 13.3 | 8.5 | 9.1 | 4.7 | 4.7 | 9.0 | 6.5 | ||
| [2002,2007) | 14.1 | 15.8 | 8.0 | 8.3 | 7.5 | 6.1 | 9.1 | 8.8 | 7.0 | 11.1 | 15.4 | 8.9 | 12.4 | 8.0 | 7.7 | 10.4 | 9.5 | ||
| [1997,2002) | 17.5 | 23.5 | 11.8 | 10.0 | 7.2 | 5.2 | 10.3 | 11.5 | 12.5 | 18.9 | 25.2 | 15.5 | 18.4 | 9.8 | 8.5 | 17.8 | 13.2 | ||
| [1992,1997) | 8.9 | 8.6 | 7.4 | 6.2 | 4.7 | 5.0 | 6.9 | 6.8 | 9.5 | 10.3 | 13.6 | 9.3 | 8.9 | 6.0 | 6.2 | 11.0 | 8.0 | ||
| [1987,1992) | 23.7 | 22.4 | 21.1 | 17.6 | 15.4 | 14.7 | 14.8 | 15.1 | 19.3 | 28.0 | 26.9 | 26.1 | 24.0 | 17.8 | 14.9 | 24.7 | 20.2 | ||
| Year | |||||||||||||||||||
| 2017 | 17.5 | 13.0 | 6.5 | 5.9 | 5.5 | 4.2 | 5.1 | 3.7 | 5.7 | 10.4 | 11.8 | 12.2 | 13.8 | 6.0 | 4.4 | 9.1 | 8.1 | ||
| 2016 | 18.3 | 14.7 | 7.7 | 5.8 | 5.9 | 6.7 | 7.9 | 8.7 | 10.1 | 12.3 | 17.1 | 16.5 | 16.4 | 6.5 | 7.9 | 12.8 | 10.4 | ||
| 2015 | 17.9 | 24.6 | 13.5 | 10.0 | 4.3 | 7.6 | 8.0 | 9.5 | 9.6 | 14.3 | 22.2 | 17.0 | 19.3 | 9.5 | 8.3 | 14.7 | 12.4 | ||
| 2014 | 13.3 | 17.2 | 7.0 | 9.3 | 5.9 | 9.5 | 9.3 | 5.8 | 12.9 | 11.8 | 15.4 | 17.2 | 16.4 | 7.9 | 8.3 | 13.1 | 10.8 | ||
| 2013 | 13.6 | 12.2 | 7.2 | 7.0 | 3.6 | 7.7 | 5.7 | 6.5 | 8.1 | 14.0 | 17.6 | 6.1 | 10.3 | 6.1 | 6.7 | 12.2 | 8.4 | ||
| 2012 | 19.4 | 13.0 | 6.4 | 5.0 | 2.7 | 2.7 | 4.0 | 4.4 | 7.1 | 8.5 | 11.8 | 9.9 | 13.7 | 4.8 | 3.7 | 8.7 | 7.0 | ||
| 2011 | 11.4 | 8.0 | 3.9 | 4.4 | 7.3 | 1.5 | 4.4 | 5.0 | 5.0 | 7.5 | 12.4 | 10.5 | 10.1 | 4.8 | 3.5 | 8.1 | 6.3 | ||
| 2010 | 13.5 | 11.4 | 4.5 | 5.5 | 3.3 | 4.0 | 3.9 | 3.5 | 5.1 | 9.4 | 11.8 | 10.3 | 11.2 | 4.7 | 3.9 | 8.0 | 6.5 | ||
| 2009 | 7.2 | 6.2 | 3.8 | 4.4 | 3.1 | 2.1 | 6.0 | 4.2 | 11.2 | 9.4 | 7.6 | 5.0 | 5.9 | 4.0 | 3.9 | 9.7 | 5.6 | ||
| 2008 | 11.7 | 7.8 | 4.5 | 3.6 | 3.4 | 4.1 | 7.1 | 8.3 | 5.9 | 7.1 | 13.5 | 7.0 | 8.6 | 3.8 | 5.9 | 7.9 | 6.1 | ||
| 2007 | 7.7 | 13.0 | 6.2 | 7.2 | 3.4 | 5.7 | 6.3 | 9.6 | 6.8 | 12.0 | 22.8 | 8.5 | 9.3 | 6.3 | 6.6 | 12.2 | 8.3 | ||
| 2006 | 12.5 | 7.8 | 4.8 | 6.4 | 4.2 | 3.4 | 13.5 | 3.7 | 3.2 | 5.9 | 15.2 | 8.0 | 9.3 | 5.5 | 7.1 | 6.5 | 6.9 | ||
| 2005 | 8.1 | 7.5 | 9.3 | 4.4 | 7.6 | 4.0 | 4.3 | 10.9 | 5.6 | 7.1 | 10.4 | 5.7 | 6.7 | 7.4 | 5.4 | 7.6 | 6.9 | ||
| 2004 | 15.1 | 21.7 | 5.3 | 9.9 | 5.2 | 3.7 | 7.3 | 11.1 | 4.7 | 10.4 | 10.7 | 3.7 | 13.6 | 6.7 | 6.4 | 8.2 | 8.9 | ||
| 2003 | 19.7 | 18.0 | 6.8 | 11.9 | 10.1 | 7.2 | 8.1 | 11.0 | 10.3 | 16.1 | 20.9 | 14.3 | 17.0 | 9.4 | 8.7 | 14.9 | 12.1 | ||
| 2002 | 14.9 | 20.3 | 13.9 | 10.3 | 9.5 | 10.0 | 11.3 | 7.9 | 13.2 | 15.5 | 24.7 | 14.5 | 16.1 | 11.2 | 9.8 | 16.1 | 12.9 | ||
| 2001 | 20.0 | 31.3 | 14.2 | 14.3 | 9.1 | 6.2 | 11.0 | 11.9 | 9.6 | 20.5 | 26.0 | 15.3 | 21.5 | 13.0 | 9.3 | 16.8 | 14.9 | ||
| 2000 | 24.6 | 33.3 | 13.5 | 10.1 | 8.8 | 5.4 | 9.1 | 12.9 | 19.2 | 26.5 | 28.2 | 20.4 | 25.8 | 10.8 | 8.7 | 23.8 | 16.0 | ||
| 1999 | 14.7 | 10.3 | 9.2 | 6.3 | 5.8 | 5.0 | 12.4 | 12.1 | 14.1 | 17.5 | 27.3 | 17.8 | 15.4 | 7.2 | 9.6 | 19.5 | 13.0 | ||
| 1998 | 5.4 | 11.3 | 10.6 | 5.4 | 5.3 | 5.7 | 7.4 | 5.7 | 3.2 | 7.7 | 25.9 | 8.0 | 8.5 | 7.3 | 6.2 | 8.2 | 7.4 | ||
| 1997 | 6.9 | 8.6 | 6.4 | 9.2 | 5.1 | 1.9 | 11.8 | 8.8 | 10.0 | 6.4 | 6.7 | 4.2 | 6.5 | 6.6 | 6.1 | 7.2 | 6.6 | ||
| 1996 | 13.4 | 5.3 | 9.3 | 5.3 | 0.9 | 5.1 | 2.9 | 4.7 | 8.8 | 7.8 | 8.6 | 14.9 | 10.9 | 4.7 | 4.2 | 8.5 | 6.8 | ||
| 1995 | 6.5 | 6.2 | 6.8 | 4.3 | 6.4 | 4.6 | 8.0 | 4.8 | 3.1 | 12.1 | 14.3 | 11.7 | 7.9 | 5.6 | 6.1 | 9.7 | 7.3 | ||
| 1994 | 11.8 | 7.8 | 11.8 | 9.3 | 3.7 | 8.7 | 10.3 | 10.3 | 10.2 | 6.1 | 8.8 | 4.5 | 7.4 | 7.2 | 9.9 | 8.0 | 8.0 | ||
| 1993 | 10.2 | 19.2 | 1.6 | 6.7 | 3.0 | 4.3 | 12.2 | 9.4 | 13.6 | 13.3 | 14.3 | 7.2 | 12.8 | 3.9 | 8.7 | 13.8 | 9.9 | ||
| 1992 | 4.6 | 5.6 | 7.1 | 7.4 | 11.1 | 3.2 | 3.4 | 7.3 | 14.1 | 15.3 | 21.1 | 6.7 | 5.6 | 8.4 | 4.3 | 17.0 | 9.1 | ||
| 1991 | 14.2 | 9.6 | 9.3 | 7.8 | 10.3 | 5.4 | 5.4 | 4.0 | 11.1 | 25.4 | 11.5 | 16.0 | 12.9 | 9.1 | 5.0 | 15.8 | 10.8 | ||
| 1990 | 24.5 | 24.3 | 15.1 | 4.1 | 15.9 | 13.9 | 9.7 | 15.5 | 10.2 | 20.2 | 21.9 | 23.7 | 24.3 | 11.7 | 13.0 | 17.1 | 17.5 | ||
| 1989 | 25.0 | 21.6 | 25.8 | 22.7 | 18.2 | 19.6 | 17.0 | 19.1 | 21.1 | 30.3 | 29.6 | 28.0 | 24.5 | 22.4 | 18.6 | 26.9 | 23.0 | ||
| 1988 | 27.6 | 26.1 | 24.2 | 24.6 | 17.6 | 17.9 | 18.1 | 14.9 | 25.7 | 33.2 | 28.3 | 27.5 | 27.0 | 21.7 | 17.0 | 29.0 | 23.8 | ||
| 1987 | 18.2 | 26.7 | 21.1 | 14.5 | 13.1 | 10.0 | 13.8 | 14.2 | 17.7 | 25.5 | 29.7 | 26.5 | 26.1 | 15.9 | 12.7 | 24.5 | 18.5 | ||
| 1986 | 38.5 | 26.3 | 43.4 | 33.3 | 38.3 | 23.5 | 21.7 | 16.7 | 9.7 | 35.3 | 48.3 | 37.1 | 33.3 | 39.0 | 20.4 | 31.5 | 31.9 | ||
| 1985 | 3.3 | 3.3 | 5.8 | 2.3 | 1.8 | 1.7 | 12.5 | 11.8 | 18.2 | 10.5 | 20.0 | 42.9 | 15.9 | 3.1 | 4.7 | 15.0 | 7.4 | ||
| 1984 | 0.0 | 0.0 | 0.0 | 0.0 | 0.0 | 0.0 | 0.0 | 0.0 | 3.7 | 2.9 | 6.5 | 2.9 | 2.0 | 0.0 | 0.0 | 4.3 | 2.1 | ||
| 1983 | 0.0 | 0.0 | 0.0 | 0.0 | 22.2 | 15.4 | 0.0 | 0.0 | 0.0 | - | 0.0 | 0.0 | 0.0 | 7.4 | 6.7 | 0.0 | 4.0 | ||
| 1982 | - | 0.0 | - | 0.0 | 0.0 | 0.0 | - | 0.0 | - | 0.0 | - | 0.0 | 0.0 | 0.0 | 0.0 | 0.0 | 0.0 | ||
Breeding data
Breeding records by month
Number of breeding records by breeding code and month, 2017 and all years| Breeding code | Jul | Aug | Sep | Oct | Nov | Dec | Jan | Feb | Mar | Apr | May | Jun |
|---|---|---|---|---|---|---|---|---|---|---|---|---|
| 2017 | ||||||||||||
| Breeding (BLA code) | 0 | 0 | 0 | 0 | 0 | 0 | 0 | 0 | 0 | 1 | 0 | 0 |
| Carrying Food | 0 | 0 | 0 | 0 | 0 | 0 | 0 | 0 | 0 | 0 | 0 | 0 |
| Copulating | 0 | 0 | 0 | 0 | 0 | 0 | 0 | 0 | 0 | 0 | 0 | 0 |
| Display | 0 | 0 | 0 | 0 | 0 | 0 | 0 | 0 | 0 | 0 | 0 | 0 |
| Dependent young | 0 | 0 | 0 | 0 | 3 | 0 | 1 | 0 | 0 | 0 | 0 | 0 |
| Faecal sac | 0 | 0 | 0 | 0 | 0 | 0 | 0 | 0 | 0 | 0 | 0 | 0 |
| Inspecting hollow | 0 | 0 | 0 | 0 | 0 | 0 | 0 | 0 | 0 | 0 | 0 | 0 |
| Nest building | 0 | 0 | 0 | 0 | 0 | 0 | 0 | 0 | 0 | 0 | 0 | 0 |
| Nest with eggs | 0 | 0 | 0 | 0 | 0 | 0 | 0 | 0 | 0 | 0 | 0 | 0 |
| Nest with young | 0 | 0 | 0 | 0 | 0 | 0 | 0 | 0 | 0 | 0 | 0 | 0 |
| On/leaving nest | 0 | 0 | 0 | 0 | 0 | 0 | 0 | 0 | 0 | 0 | 0 | 0 |
| All years | ||||||||||||
| Breeding (BLA code) | 1 | 1 | 1 | 2 | 0 | 1 | 0 | 0 | 3 | 1 | 0 | 0 |
| Carrying Food | 0 | 0 | 0 | 2 | 0 | 1 | 1 | 0 | 0 | 0 | 0 | 0 |
| Copulating | 0 | 0 | 0 | 0 | 0 | 0 | 0 | 0 | 0 | 0 | 0 | 0 |
| Display | 0 | 1 | 0 | 1 | 0 | 0 | 0 | 0 | 0 | 0 | 3 | 0 |
| Dependent young | 0 | 1 | 0 | 2 | 5 | 1 | 6 | 2 | 3 | 0 | 0 | 0 |
| Faecal sac | 0 | 0 | 0 | 0 | 0 | 0 | 0 | 0 | 0 | 0 | 0 | 0 |
| Inspecting hollow | 0 | 0 | 0 | 0 | 0 | 0 | 0 | 0 | 0 | 0 | 0 | 0 |
| Nest building | 0 | 1 | 1 | 3 | 2 | 1 | 0 | 0 | 0 | 0 | 0 | 0 |
| Nest with eggs | 0 | 0 | 0 | 1 | 0 | 0 | 0 | 1 | 0 | 0 | 0 | 0 |
| Nest with young | 0 | 0 | 0 | 0 | 0 | 1 | 0 | 1 | 0 | 0 | 0 | 0 |
| On/leaving nest | 0 | 1 | 0 | 0 | 0 | 0 | 0 | 1 | 0 | 0 | 0 | 0 |
Breeding records by year
Average number of breeding records per period by breeding code| Period | Breeding (BLA code) | Carrying Food | Copulating | Display | Dependent young | Faecal sac | Inspecting hollow | Nest building | Nest with eggs | Nest with young | On/leaving nest |
|---|---|---|---|---|---|---|---|---|---|---|---|
| All years | |||||||||||
| All | 0.3 | 0.1 | 0.0 | 0.1 | 0.6 | 0.0 | 0.0 | 0.2 | 0.1 | 0.1 | 0.1 |
| Previous years | |||||||||||
| All previous years | 0.3 | 0.1 | 0.0 | 0.1 | 0.5 | 0.0 | 0.0 | 0.2 | 0.1 | 0.1 | 0.1 |
| Previous 30 years | 0.3 | 0.1 | 0.0 | 0.2 | 0.5 | 0.0 | 0.0 | 0.3 | 0.1 | 0.1 | 0.1 |
| Previous 20 years | 0.5 | 0.1 | 0.0 | 0.2 | 0.4 | 0.0 | 0.0 | 0.2 | 0.0 | 0.0 | 0.1 |
| 10 year groups | |||||||||||
| [2007,2017) | 0.5 | 0.1 | 0.0 | 0.5 | 0.5 | 0.0 | 0.0 | 0.2 | 0.0 | 0.0 | 0.1 |
| [1997,2007) | 0.4 | 0.2 | 0.0 | 0.0 | 0.3 | 0.0 | 0.0 | 0.2 | 0.0 | 0.1 | 0.1 |
| [1987,1997) | 0.0 | 0.1 | 0.0 | 0.0 | 0.8 | 0.0 | 0.0 | 0.4 | 0.2 | 0.1 | 0.0 |
| 5 year groups | |||||||||||
| [2012,2017) | 0.2 | 0.2 | 0.0 | 1.0 | 0.6 | 0.0 | 0.0 | 0.2 | 0.0 | 0.0 | 0.2 |
| [2007,2012) | 0.8 | 0.0 | 0.0 | 0.0 | 0.4 | 0.0 | 0.0 | 0.2 | 0.0 | 0.0 | 0.0 |
| [2002,2007) | 0.6 | 0.0 | 0.0 | 0.0 | 0.2 | 0.0 | 0.0 | 0.2 | 0.0 | 0.0 | 0.0 |
| [1997,2002) | 0.2 | 0.4 | 0.0 | 0.0 | 0.4 | 0.0 | 0.0 | 0.2 | 0.0 | 0.2 | 0.2 |
| [1992,1997) | 0.0 | 0.0 | 0.0 | 0.0 | 0.2 | 0.0 | 0.0 | 0.0 | 0.0 | 0.0 | 0.0 |
| [1987,1992) | 0.0 | 0.2 | 0.0 | 0.0 | 1.4 | 0.0 | 0.0 | 0.8 | 0.4 | 0.2 | 0.0 |
| Year | |||||||||||
| 2017 | 1.0 | 0.0 | 0.0 | 0.0 | 4.0 | 0.0 | 0.0 | 0.0 | 0.0 | 0.0 | 0.0 |
| 2016 | 0.0 | 0.0 | 0.0 | 0.0 | 1.0 | 0.0 | 0.0 | 0.0 | 0.0 | 0.0 | 0.0 |
| 2015 | 0.0 | 0.0 | 0.0 | 4.0 | 2.0 | 0.0 | 0.0 | 1.0 | 0.0 | 0.0 | 1.0 |
| 2014 | 1.0 | 1.0 | 0.0 | 0.0 | 0.0 | 0.0 | 0.0 | 0.0 | 0.0 | 0.0 | 0.0 |
| 2013 | 0.0 | 0.0 | 0.0 | 1.0 | 0.0 | 0.0 | 0.0 | 0.0 | 0.0 | 0.0 | 0.0 |
| 2012 | 0.0 | 0.0 | 0.0 | 0.0 | 0.0 | 0.0 | 0.0 | 0.0 | 0.0 | 0.0 | 0.0 |
| 2011 | 0.0 | 0.0 | 0.0 | 0.0 | 0.0 | 0.0 | 0.0 | 0.0 | 0.0 | 0.0 | 0.0 |
| 2010 | 0.0 | 0.0 | 0.0 | 0.0 | 0.0 | 0.0 | 0.0 | 0.0 | 0.0 | 0.0 | 0.0 |
| 2009 | 1.0 | 0.0 | 0.0 | 0.0 | 0.0 | 0.0 | 0.0 | 0.0 | 0.0 | 0.0 | 0.0 |
| 2008 | 0.0 | 0.0 | 0.0 | 0.0 | 2.0 | 0.0 | 0.0 | 0.0 | 0.0 | 0.0 | 0.0 |
| 2007 | 3.0 | 0.0 | 0.0 | 0.0 | 0.0 | 0.0 | 0.0 | 1.0 | 0.0 | 0.0 | 0.0 |
| 2006 | 3.0 | 0.0 | 0.0 | 0.0 | 0.0 | 0.0 | 0.0 | 1.0 | 0.0 | 0.0 | 0.0 |
| 2005 | 0.0 | 0.0 | 0.0 | 0.0 | 0.0 | 0.0 | 0.0 | 0.0 | 0.0 | 0.0 | 0.0 |
| 2004 | 0.0 | 0.0 | 0.0 | 0.0 | 1.0 | 0.0 | 0.0 | 0.0 | 0.0 | 0.0 | 0.0 |
| 2003 | 0.0 | 0.0 | 0.0 | 0.0 | 0.0 | 0.0 | 0.0 | 0.0 | 0.0 | 0.0 | 0.0 |
| 2002 | 0.0 | 0.0 | 0.0 | 0.0 | 0.0 | 0.0 | 0.0 | 0.0 | 0.0 | 0.0 | 0.0 |
| 2001 | 0.0 | 1.0 | 0.0 | 0.0 | 0.0 | 0.0 | 0.0 | 1.0 | 0.0 | 0.0 | 0.0 |
| 2000 | 0.0 | 1.0 | 0.0 | 0.0 | 0.0 | 0.0 | 0.0 | 0.0 | 0.0 | 0.0 | 1.0 |
| 1999 | 1.0 | 0.0 | 0.0 | 0.0 | 2.0 | 0.0 | 0.0 | 0.0 | 0.0 | 0.0 | 0.0 |
| 1998 | 0.0 | 0.0 | 0.0 | 0.0 | 0.0 | 0.0 | 0.0 | 0.0 | 0.0 | 0.0 | 0.0 |
| 1997 | 0.0 | 0.0 | 0.0 | 0.0 | 0.0 | 0.0 | 0.0 | 0.0 | 0.0 | 1.0 | 0.0 |
| 1996 | 0.0 | 0.0 | 0.0 | 0.0 | 0.0 | 0.0 | 0.0 | 0.0 | 0.0 | 0.0 | 0.0 |
| 1995 | 0.0 | 0.0 | 0.0 | 0.0 | 1.0 | 0.0 | 0.0 | 0.0 | 0.0 | 0.0 | 0.0 |
| 1994 | 0.0 | 0.0 | 0.0 | 0.0 | 0.0 | 0.0 | 0.0 | 0.0 | 0.0 | 0.0 | 0.0 |
| 1993 | 0.0 | 0.0 | 0.0 | 0.0 | 0.0 | 0.0 | 0.0 | 0.0 | 0.0 | 0.0 | 0.0 |
| 1992 | 0.0 | 0.0 | 0.0 | 0.0 | 0.0 | 0.0 | 0.0 | 0.0 | 0.0 | 0.0 | 0.0 |
| 1991 | 0.0 | 0.0 | 0.0 | 0.0 | 0.0 | 0.0 | 0.0 | 1.0 | 0.0 | 0.0 | 0.0 |
| 1990 | 0.0 | 0.0 | 0.0 | 0.0 | 0.0 | 0.0 | 0.0 | 0.0 | 0.0 | 0.0 | 0.0 |
| 1989 | 0.0 | 0.0 | 0.0 | 0.0 | 3.0 | 0.0 | 0.0 | 0.0 | 1.0 | 1.0 | 0.0 |
| 1988 | 0.0 | 0.0 | 0.0 | 0.0 | 1.0 | 0.0 | 0.0 | 3.0 | 0.0 | 0.0 | 0.0 |
| 1987 | 0.0 | 1.0 | 0.0 | 0.0 | 3.0 | 0.0 | 0.0 | 0.0 | 1.0 | 0.0 | 0.0 |
| 1986 | 0.0 | 0.0 | 0.0 | 0.0 | 0.0 | 0.0 | 0.0 | 0.0 | 0.0 | 0.0 | 0.0 |
| 1985 | 0.0 | 0.0 | 0.0 | 0.0 | 0.0 | 0.0 | 0.0 | 0.0 | 0.0 | 0.0 | 0.0 |
| 1984 | 0.0 | 0.0 | 0.0 | 0.0 | 0.0 | 0.0 | 0.0 | 0.0 | 0.0 | 0.0 | 0.0 |
| 1983 | 0.0 | 0.0 | 0.0 | 0.0 | 0.0 | 0.0 | 0.0 | 0.0 | 0.0 | 0.0 | 0.0 |
| 1982 | 0.0 | 0.0 | 0.0 | 0.0 | 0.0 | 0.0 | 0.0 | 0.0 | 0.0 | 0.0 | 0.0 |
Distribution map
Distribution - 2017
This map shows the observed distribution of the Eastern Spinebill for 2017.
The red circles are the grid cells where Eastern Spinebill have been reported.
The transparency of the red circles indicate how many surveys sheets were submitted for that grid cell; the darker the red the more reliable the data. Of the 315 grid cells with reports, 83 had only one sheet; an example is grid number A9.
The size of the circle represents the reporting rate. The maximum reporting rate for Eastern Spinebill was 100.0% (eg grid number A9) and the minimum was 0.1% (eg grid number J14). 
Distribution - all years
This map shows the observed distribution of the Eastern Spinebill for all years.
The red circles are the grid cells where Eastern Spinebill have been reported.
The transparency of the red circles indicate how many surveys sheets were submitted for that grid cell; the darker the red the more reliable the data. Of the 703 grid cells with reports, 55 had only one sheet; an example is grid number A5.
The size of the circle represents the reporting rate. The maximum reporting rate for Eastern Spinebill was 100.0% (eg grid number A5) and the minimum was 0.3% (eg grid number S13). 
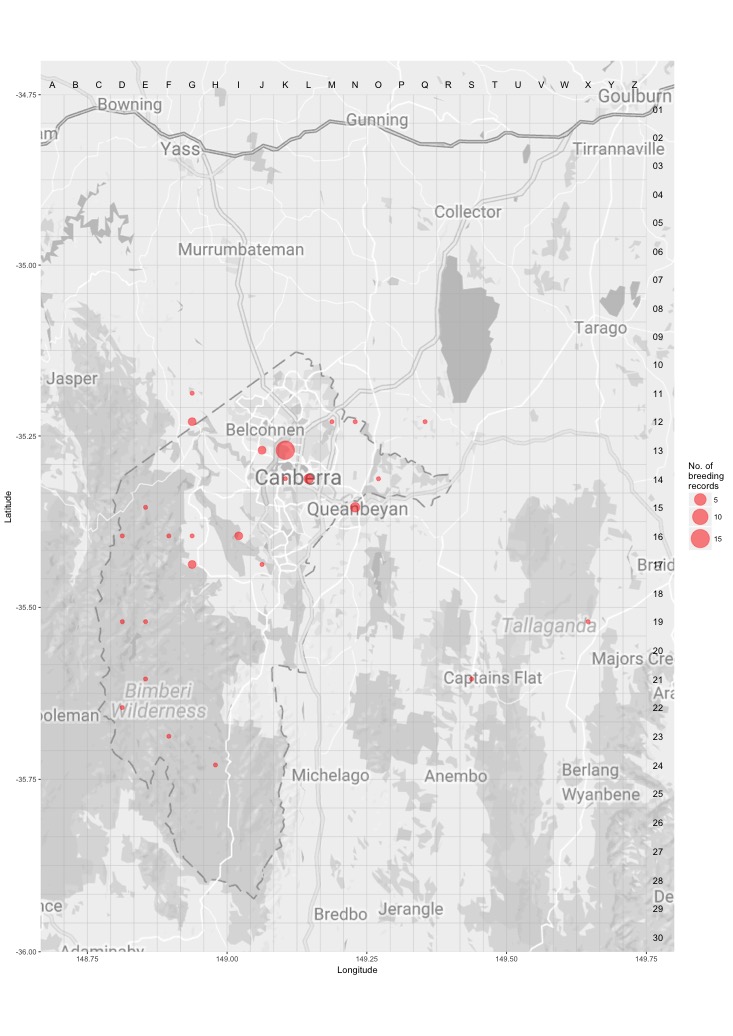
Breeding map
Breeding - 2017
This map shows the breeding distribution of the Eastern Spinebill for 2017.
The red circles are the grid cells where breeding activity for Eastern Spinebill have been reported.
The size of the circle represents the number of reports. 
Breeding - all years
This map shows the breeding distribution of the Eastern Spinebill for all years.
The red circles are the grid cells where breeding activity for Eastern Spinebill have been reported.
The size of the circle represents the number of reports.